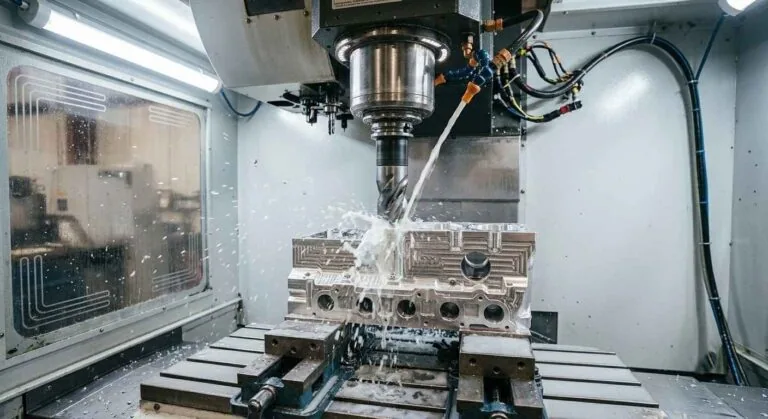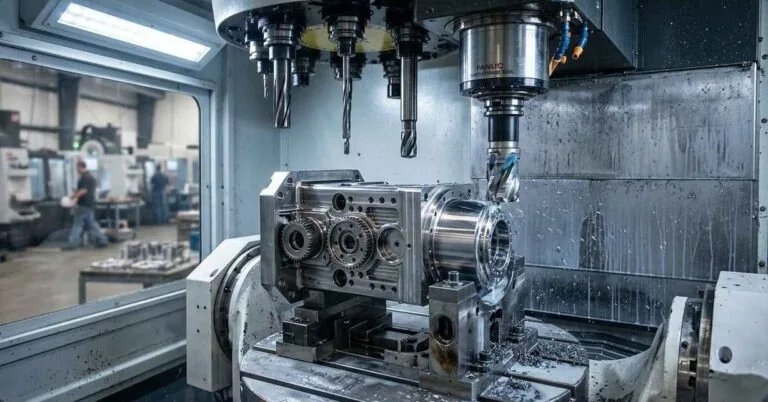

A supplier quoting “99.7% quality” is quoting a number that sounds like perfection and behaves like three failures per thousand parts. On a 50,000-piece annual programme that is 150 nonconforming parts reaching your goods-in. Whether that is excellent or unacceptable depends on what the part does, what the contract says, and how the number was counted — and most published figures do not say.
This article covers the arithmetic and the evidence behind a CNC defect rate benchmark: how conformance rates, parts per million, sigma levels and capability indices convert into one another, which standards govern the reporting, and what documentation substantiates a claimed rate during an audit.
Key takeaways
- A 99.7% conformance rate equals 3,000 defective parts per million (DPPM) and corresponds to a centred process capability of roughly Cpk 0.99 — barely at the classic three-sigma threshold, not above it.
- Cpk 1.33 (the ongoing minimum in most automotive and aerospace supply agreements) is about 63 DPPM; Cpk 1.67 is under 1 DPPM. The jump from 99.7% to Cpk 1.67 is a factor of roughly 5,000 in escape rate.
- Two sigma conventions are in circulation — centred short-term and the 1.5-sigma-shifted convention used in Six Sigma. The same process reads 1.5σ apart depending on which is applied.
- Capability and control-chart methods are standardised: ISO 7870-2:2023 for Shewhart charts, ISO 22514-4 for capability estimates, ISO 2859-1 for attribute sampling by AQL.
- A defect-rate figure is auditable only with its denominator, the characteristics counted, a gauge study, and calibration traceable to a national metrology institute such as NIST.
- MW+ works to Cpk ≥1.67 on controlled characteristics at a ±0.005 mm precision band, with a ±0.001 mm floor and general tolerances to ±0.01 mm per ISO 2768-m.
What this article covers
- What does a 99.7% quality rate actually mean?
- How is a CNC defect rate benchmark measured?
- What defect rate should you expect from a CNC supplier?
- Worked calculation: from Cpk to escaped parts
- Statistical process control: the system behind a low defect rate
- Where CNC defects actually originate
- Which standards govern defect-rate and capability reporting?
- How do you audit a supplier’s defect-rate claim?
- When chasing a lower defect rate is the wrong call
- Frequently asked questions
What does a 99.7% quality rate actually mean?
99.7% is not an arbitrary marketing figure. It is close to 99.73%, the proportion of a normal distribution lying within ±3 standard deviations of the mean — which is why “three sigma” and “99.7%” are used interchangeably, and why the figure deserves scepticism. Three sigma is the entry level of statistical control, not the top of it.
Converting between the four units buyers encounter — conformance rate, defective parts per million, sigma level and Cpk — is arithmetic once the convention is fixed. For a centred, normally distributed characteristic with two-sided limits, the expected fraction outside specification is 2 × Φ(−3 × Cpk), where Φ is the standard normal cumulative distribution function.
Table 1 — Conformance rate, DPPM, sigma level and Cpk
| Conformance rate | Defective parts per million | Centred sigma level (Z) | Equivalent Cpk (centred) | Sigma under the 1.5σ-shift convention |
| 99.0% | 10,000 | 2.58 | 0.86 | ≈ 3.8σ |
| 99.7% | 3,000 | 2.97 | 0.99 | ≈ 4.2σ |
| 99.73% | 2,700 | 3.00 | 1.00 | ≈ 4.2σ |
| 99.9% | 1,000 | 3.29 | 1.10 | ≈ 4.6σ |
| 99.99% | 100 | 3.89 | 1.30 | ≈ 5.2σ |
| 99.9937% | 63 | 4.00 | 1.33 | ≈ 5.4σ |
| 99.99994% | 0.6 | 5.01 | 1.67 | ≈ 6.5σ |
Derived from the standard normal distribution: DPPM = 2 × Φ(−Z) × 106, Cpk = Z ÷ 3 for a centred two-sided characteristic. Capability index definitions per ISO 22514-4.
Two things follow. A headline of “99.7%” describes a process at roughly Cpk 1.0 — below the Cpk 1.33 minimum most automotive and aerospace agreements specify for ongoing production. And the gap between Cpk 1.33 and Cpk 1.67, small on paper, separates about 63 escaped parts per million from fewer than one.
How is a CNC defect rate benchmark measured?
Before comparing two suppliers’ numbers, establish that they count the same thing. The metrics below are routinely quoted as interchangeable and are not.
First-pass yield versus rolled throughput yield
First-pass yield (FPY) is the proportion of units clearing every operation without rework or scrap. Rolled throughput yield (RTY) multiplies the operations: a five-operation part at 99.5% each has an RTY of 0.9955 = 97.5%. Final yield counts everything that ships, reworked units included, so it is the highest and least informative of the three — and it is what an unqualified “99.8% yield” usually means.
Counting units: parts per million defective versus defects per million opportunities
DPPM counts nonconforming parts; DPMO counts nonconforming characteristics over inspected characteristics per part. A part with 40 toleranced features and one bad bore is 1,000,000 DPPM at a batch of one but 25,000 DPMO — so DPMO flatters the supplier as drawing complexity rises.
Table 2 — Quality metrics, formulas and what each one hides
| Metric | Formula | What it tells you | What it hides |
| First-pass yield | units passing all ops first time ÷ units started | True process health | The most honest single figure |
| Final yield | units shipped ÷ units started | Delivery performance | Rework hours, sorting cost, schedule impact |
| Rolled throughput yield | product of each operation’s FPY | Compound risk across a routing | Which operation is the weak one |
| DPPM | nonconforming parts ÷ parts inspected × 106 | Escape risk per part | Whether inspection was 100% or sampled |
| DPMO | defects ÷ (units × opportunities per unit) × 106 | Characteristic-level performance | Flattered by high feature counts |
| Cpk / Ppk | min[(USL−μ), (μ−LSL)] ÷ 3σ | Predicted escape rate | Needs normality and stability to be valid |
Cpk uses within-subgroup variation and describes potential when the process is stable; Ppk uses total observed variation and describes what actually happened. A large gap between them signals drift between subgroups, not capability. ISO 22514-4 sets the estimation rules; ISO 22514-3 covers short-run machine performance studies, the right instrument for qualifying a new machine or fixture.

What defect rate should you expect from a CNC supplier?
There is no credible universal table of defect rates by shop type — such numbers circulate widely and almost none trace to a published methodology. What is verifiable is the level your own contract specifies. Attribute acceptance sampling is indexed by acceptance quality limit under ISO 2859-1 (current edition 2026). AQL is expressed as nonconforming items per hundred, so it converts directly to parts per million — the most useful benchmark a buyer has, because it states what the supplier is contractually permitted to deliver.
Table 3 — AQL levels translated into parts per million
| AQL (per ISO 2859-1) | Equivalent nonconforming | Parts per million | Typically specified for |
| 0.010 | 0.010% | 100 | Flight-safety and implantable characteristics |
| 0.065 | 0.065% | 650 | Critical dimensional characteristics |
| 0.25 | 0.25% | 2,500 | Major functional characteristics |
| 0.65 | 0.65% | 6,500 | General dimensional characteristics |
| 1.5 | 1.5% | 15,000 | Minor / cosmetic characteristics |
| 4.0 | 4.0% | 40,000 | Non-functional appearance items |
AQL values and sampling plans per ISO 2859-1. AQL is a limit on the process average for acceptance purposes, not a target and not a guarantee for any single lot.
The implication: a drawing accepted at AQL 0.65 permits a long-run average of 6,500 DPPM — twice the escape rate implied by a “99.7% quality” claim. Where the advertised rate and the AQL disagree, the contract governs. Tighten the AQL where it matters and loosen it elsewhere; that beats demanding a blanket improvement.

Worked calculation: from Cpk to escaped parts
This converts a capability index into a number of parts, step by step. The inputs are assumed values chosen to make the arithmetic concrete; substitute your own.
Given: a bore specified 12.000 mm ±0.020 mm. A study of 125 parts in 25 subgroups of 5 returns a mean of 12.004 mm and a within-subgroup standard deviation of 0.0045 mm. Annual volume 40,000 parts.
Step 1 — Limits. USL = 12.020 mm, LSL = 11.980 mm; tolerance band 0.040 mm.
Step 2 — Cp (potential capability). Cp = (USL − LSL) ÷ 6σ = 0.040 ÷ 0.027 = 1.48.
Step 3 — Cpk (actual capability, mean off centre).
Upper side: (USL − μ) ÷ 3σ = (12.020 − 12.004) ÷ (3 × 0.0045) = 0.016 ÷ 0.0135 = 1.185
Lower side: (μ − LSL) ÷ 3σ = (12.004 − 11.980) ÷ 0.0135 = 0.024 ÷ 0.0135 = 1.778
Cpk = the smaller of the two = 1.19.
Step 4 — Convert Cpk to an expected escape rate. The binding side sits 1.185 × 3 = 3.56 standard deviations from the mean. Φ(−3.56) ≈ 0.000185, so about 185 per million fall outside on that side; the lower side contributes Φ(−5.33) ≈ 0.00000005, negligible. Total ≈ 185 DPPM, a conformance rate of 99.98%.
Step 5 — Convert to parts. 185 ÷ 1,000,000 × 40,000 = 7.4 nonconforming parts a year from this characteristic alone.
Step 6 — Test the effect of centring. Correct the tool offset so the mean sits at 12.000 mm with the same spread and Cpk rises to equal Cp at 1.48. The binding side is then 4.44σ out, Φ(−4.44) ≈ 0.0000045, giving about 9 DPPM two-sided — roughly 0.36 parts per year. Re-centring alone, with no change in machine, tooling or fixture, removes about 95% of expected escapes.
That last step is the argument for offset correction driven by control charts rather than end-of-run inspection. Variation reduction is slow and expensive; centring is neither. A supplier that cannot say where its process mean sits relative to nominal is not using the cheaper of the two levers.
Statistical process control: the system behind a low defect rate
Inspection detects defects; statistical process control prevents them. The distinction matters because 100% inspection is itself imperfect — measurement error rejects good parts and passes bad ones — so a shop that sorts rather than controls has an escape-rate floor no extra inspection will break.
Control limits are not specification limits
The most common misuse of control charts on a shop floor is drawing the specification limits on the chart. Control limits describe what the process does; specification limits describe what the drawing demands. Plot the latter and the chart cannot signal until parts are already out of tolerance. ISO 7870-2:2023 sets control limits at ±3 standard errors of the plotted statistic, derived from the process itself.
Subgroup size, sampling frequency and the tests for special causes
Subgroups of four or five consecutive parts are conventional, because within-subgroup variation is then a clean estimate of short-term noise. Sampling frequency should track how fast the process drifts: every fifth part on a high-removal operation with rapid flank wear, hourly on a stable finishing pass. ISO 7870-2 defines the pattern tests for special causes — runs, trends, points beyond the limits, stratification — which turn a chart into an alarm.
Measurement system analysis comes first
A capability index computed on a gauge that cannot resolve the tolerance is fiction. Gauge repeatability and reproducibility consuming under 10% of the tolerance band is acceptable; above 30% is not. ISO 22514-7:2021 covers capability of measurement processes, ISO 10360-2 CMM acceptance and reverification, and ISO/IEC 17025:2017 laboratory competence.
Calibration traceability
Every gauge must trace to a national metrology institute. The NIST policy on metrological traceability defines a defensible statement: an unbroken calibration chain, a stated uncertainty at each link, documented competence of the calibrating body. A certificate with no uncertainty budget is not traceability.
Where CNC defects actually originate
Benchmarking is only actionable once decomposed. The table groups recurring failure modes by the control that addresses each — a diagnostic map, not a frequency ranking.
Table 4 — Defect modes, root causes and the control that catches them
| Defect mode | Typical mechanism | Detection | Preventive control |
| Progressive oversize / undersize | Flank wear shifting cutting diameter | Xbar trend on the dimension | Tool-life limits with in-cycle offset correction |
| Step change between batches | Tool change, fixture reset, new stock lot | Chart shift at a known event | First-article verification after every reset |
| Position / true position failure | Fixture repeatability, datum scheme misread | CMM with the drawing’s datum reference frame | GD&T review per ASME Y14.5 at quoting |
| Surface roughness out of spec | Feed per tooth, tool nose radius, chatter | Profilometry to ISO 21920-2 | Fixed finishing parameters, damped toolholding |
| Burrs and edge condition | Undefined edge-break callout, exit-side burr | Visual plus edge gauge | Explicit edge-break specification on the drawing |
| Material nonconformance | Substituted or mis-certified stock | Mill certificate review, PMI check | Lot traceability, bar to serial number |
| Distortion after machining | Residual stress release in thin walls | Post-machining re-measurement | Stress-relief step, rough / finish split |
Different defect families respond to different investments: distortion is not solved by more inspection, and fixture repeatability is not solved by tighter tool-life limits. Identifying which you have is what the chart is for. Our note on CMM inspection and first article inspection covers detection in more depth.
Which standards govern defect-rate and capability reporting?
Certification and statistical methodology are separate things, and buyers conflate them constantly. A certificate proves a system exists; the statistical standards define how the numbers inside it are computed.
Table 5 — Standards relevant to a CNC defect rate benchmark
| Standard | Governs | Relevance to defect rate |
| ISO 9001:2015 (superseded by ISO 9001:2026) | General QMS | Requires nonconformity control; sets no numeric target |
| AS9100D | Aviation, space, defence QMS | Adds counterfeit-part and key-characteristic control |
| IATF 16949:2016 | Automotive QMS | Mandates capability studies, control plans, PPAP |
| ISO 13485:2016 | Medical device QMS | Process validation and record retention |
| ISO 7870-2:2023 | Shewhart control charts | How control limits and special-cause tests are built |
| ISO 22514-4 | Process capability estimates | Definitions of Cp, Cpk, Pp and Ppk |
| ISO 2859-1 | Attribute sampling by AQL | Contractual acceptance level for lot-by-lot inspection |
| ISO 10360-2 | CMM acceptance and reverification | Whether the instrument is fit to judge the part |
| ISO/IEC 17025:2017 | Calibration laboratories | Competence of the lab issuing certificates |
| ISO 2768 | General tolerances | What counts as nonconforming where the drawing is silent |
| AS9102 | Aerospace first article inspection | Evidence the process was correct at part one |
| NADCAP | Special process accreditation | Heat treatment, plating and NDT |
Which of the three main certifications your programme actually needs is set out in our comparison of ISO 9001, AS9100 and IATF 16949 in CNC machining.
How do you audit a supplier’s defect-rate claim?
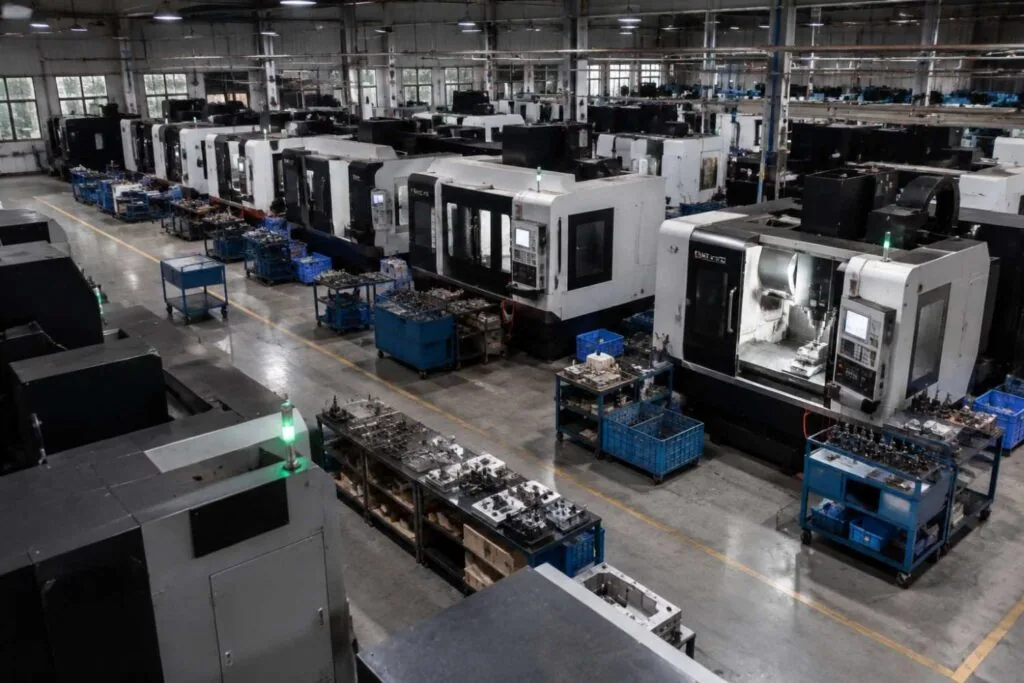
Ask for evidence, not the headline. Every item below is a document a functioning quality system already produces; one that has to be created for you does not exist.
- The denominator. Parts and characteristics inspected, and whether inspection was 100% or sampled to a stated AQL.
- Control charts for your part family, not a company average — with control limits, subgroup size and the special-cause log visible.
- Capability studies stating Cpk or Ppk, the study size, and the normality check performed.
- Gauge R&R results for the instruments used, as a percentage of tolerance.
- Calibration certificates with stated uncertainties, an unbroken traceability chain and a defined recall interval.
- Nonconformance and corrective-action records showing root-cause analysis and effectiveness verification, usually as 8D reports.
- Trend data over at least four quarters — a steadily improving rate beats a flat but better-sounding one.
MW+ ships a certificate of conformance, a CMM inspection report and material certificates with every order, with first article inspection to AS9102 or PPAP Level 3 quoted per programme. The underlying system — controlled characteristics held to Cpk ≥1.67, traceable metrology, documented corrective action — is described on our CNC machining quality control page, the equipment envelope behind it on our CNC machining capabilities page, and the component families produced under those controls under CNC precision parts.
Traceability is what buyers most often skip. If a nonconformance surfaces at your plant, containment size depends on which bars, machines and dates are implicated — the subject of our piece on full traceability in CNC machining.
When chasing a lower defect rate is the wrong call
An honest account has to say where the recommendation stops applying.
When the characteristic does not affect function. Demanding Cpk 1.67 on a clearance hole or cosmetic radius buys nothing and costs inspection time, slower finishing passes and scrapped parts that would have worked. Capability targets belong on key characteristics identified on the drawing, not on every dimension.
When the volume is too low for statistics. A capability index from 30 parts has a confidence interval wide enough to include both “capable” and “not capable”. On prototype and low-volume work the correct control is 100% dimensional verification with a documented first article; asking for Cpk data there is asking for a number that cannot mean anything. Our comparison of low-volume CNC machining cost against speed covers where that boundary falls.
When the tolerance, not the process, is the problem. Many capability failures are drawings that inherited tolerances from a previous part or applied a blanket ±0.01 mm where it was never needed. Reviewing the tolerance scheme is cheaper than investing in capability, and it is the first thing to check when a quote comes back high.
When lead time matters more. Tighter control means more gauging, more first-article cycles and more documentation. Where a two-week slip costs more than a handful of rejected parts, a looser AQL and a faster route may be right — a commercial judgement to make explicitly, not inherit from a template.
Frequently asked questions
Is a supplier quoting 99.7% better than one quoting Cpk 1.33?
No — Cpk 1.33 is the stronger position. 99.7% conformance is roughly Cpk 1.0, about 3,000 defective parts per million; Cpk 1.33 is about 63. Percentages sound better because they compress the interesting part of the range. Convert to parts per million before comparing suppliers.
Why do two suppliers with the same process report different sigma levels?
Almost always because one applied the 1.5-sigma shift used in Six Sigma and the other did not. The shift is a long-term allowance for drift and moves the reported figure by a full 1.5σ. Ask whether the number is short-term centred or long-term shifted; the two are not comparable.
Does a lower defect rate mean a higher price per part?
Not necessarily, and the framing is wrong. Control costs money in fixturing, gauging and documentation, but sorting, rework, containment and line-down events cost money too — and those land on the buyer. The comparison that matters is total programme cost including your incoming inspection and schedule risk, not the piece price.
How many parts does a capability study need to be meaningful?
Conventional practice is 125 parts in 25 subgroups of five for an ongoing study, and at least 50 consecutive parts for the short-run machine performance study described in ISO 22514-3. Below roughly 30 measurements the confidence interval on Cpk is too wide for the point estimate to carry information.
What is the difference between quality rate and first-pass yield?
Used carefully they are the same: parts meeting every requirement without rework. Used loosely, “quality rate” means final yield, which counts reworked parts as good. Ask whether reworked units sit in the numerator — if they do, the figure conceals rework cost, usually the larger loss.
What quality documentation should arrive with a production shipment?
At minimum a certificate of conformance tying the shipment to the drawing revision, a dimensional report covering the controlled characteristics, and material certificates traceable to the mill heat. Regulated programmes add a first article inspection report to AS9102 or a PPAP submission. Say so at the request-for-quote stage — retro-fitting them after production starts is expensive.
How quickly can a supplier respond with this level of detail?
A shop already running the system can return a quotation with the inspection method and documentation package defined within 24 hours of receiving a drawing. To test that, request a CNC machining quote with your tolerance scheme attached — the specificity of the reply is itself an audit. Broader guidance is in our article on how to choose the right CNC machining supplier in China.